I have long hypothesized that current MLB stars are more ephemeral compared to past decades. That is, they more quickly come and go, and longevity is increasingly rare. In my opinion, if this were true, it could serve as a partial explanation for the league’s dwindling attendance
Evaluating Stardom Approach
We all know all-star selections are not perfect. I will use my hometown team, the Royals, as an example. In 2015, at one point, the fan vote had a Royal starting at every single position. Even Omar Infante. In 2006, Mark Redman was the Royals’ all-star; he had an ERA over 5.00.
That said, I think all-star appearances are a solid barometer for stardom. Players who make an all-star team are recognizable, especially to local fans. I would also posit that many casual fans equate all-star appearances with quality. The two are certainly correlated but not perfectly.
Visually Analyzing Stardom
To analyze changes over time, we categorize players by the decade in which they debuted, starting in 1950. Data from 2000 – present is censored. That is, since some players are still active, we have an incomplete picture of their careers and need to keep this fact in mind. We do not know if the “event” we are analyzing might still occur.
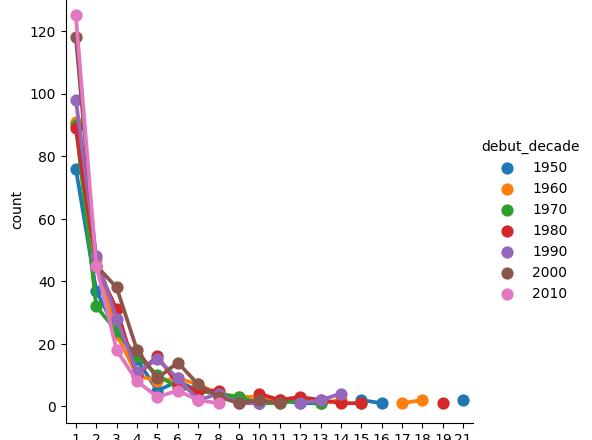
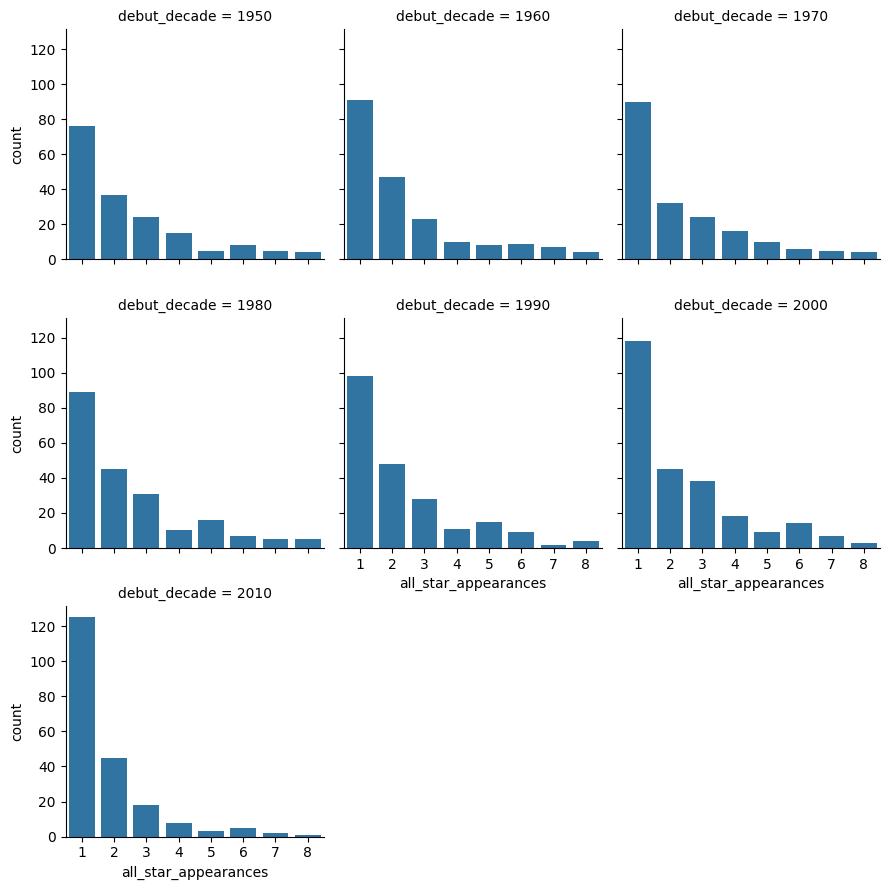
The charts below consider only players who have made an all-star game and show the frequency of appearances. As expected, the most frequent number is one: many players are all-stars only a single time. We notice the drop between one and two appearances grows quite a bit in the most recent two decades, though the censorship issue described above impacts this outcome.
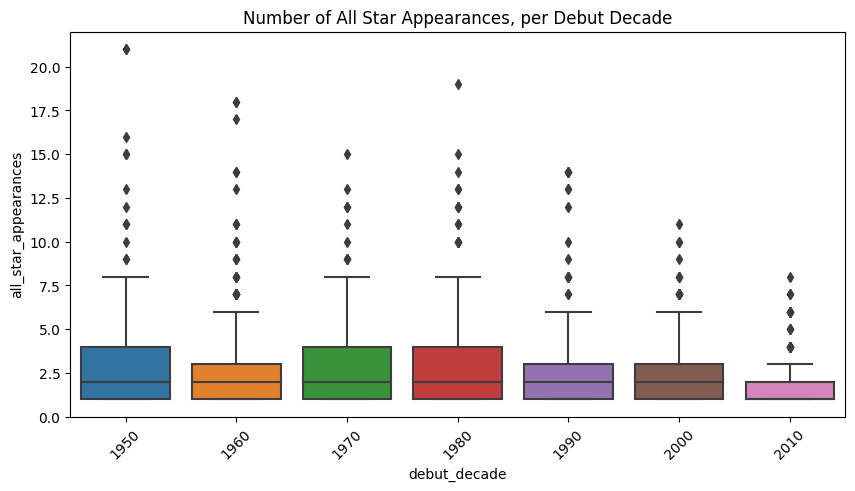
We can also view the same dataset as a boxplot. Though we have an incomplete picture of the most recent two decades, we have a potential lowering of the interquartile range over time. We can definitively say this is the case for the 1990 debut decade compared to the previous two decades (70s and 80s). This finding indicates there have been fewer multi-repeat all-stars. The trend could, however, reverse in the 2000 debut decade as some players are still active.
Visually Inspecting Stardom: Round 2
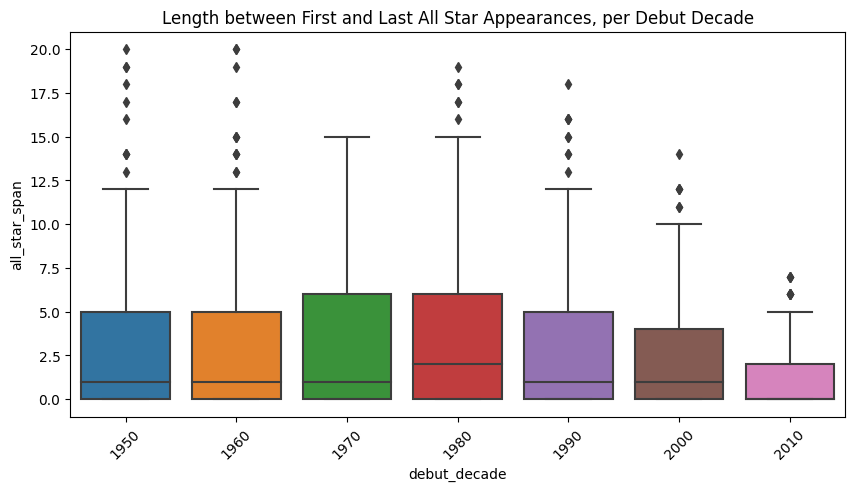
Another angle is looking at the time between the first and last all-star appearances. We see similar patterns to what we observed previously. Interestingly, the 1980 debut decade has a higher mean length.
Survival Analysis
Survival analysis estimates the time until an event occurs. The charts below use the Kaplan Meier Estimate to develop survival curves. One benefit of using Kaplan Meier is that it handles censored data.
These following charts address the question: How many seasons until a player makes an all-star game? If players make an all-star games early in their career, even if they fade later, they might retain a halo effect. That is, fans might have already tagged them as a strong player. To note, our dataset does not filter seasons on any factor, meaning we include rookie seasons that are quite short.
I do want to state that survival analysis under the given conditions could be a little messy, though I believe directionally useful. Career length and all-star appearances are inherently related. Weaker players are more likely to have short careers and less likely to make an all-star game, meaning our censorship and survival mechanisms are likely not independent. We also don’t have standardized career lengths; we can’t give players a few more years to see if they would have been an all-star. Careers end for a variety of reasons. This isn’t a typical study where patients are enrolled in a clinical trial, and survival analysis is employed on clean data. This is a main challenge of data science: finding creative opportunities to apply methodologies while maintaining awareness of the pitfalls.
Tangent over. Let’s continue.
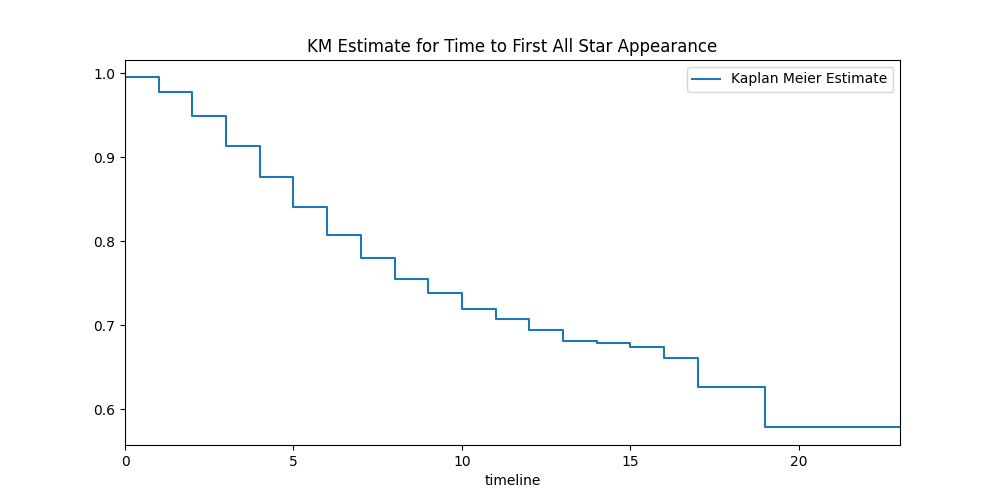
In our first chart below, we see there is nearly a 100% chance the “event” (i.e. making an all-star game) has not occurred after the first season. As expected, our survival curve drops over time. After playing 15 seasons, a player has about a 30% chance of being an all-star, conditional on no other factors.
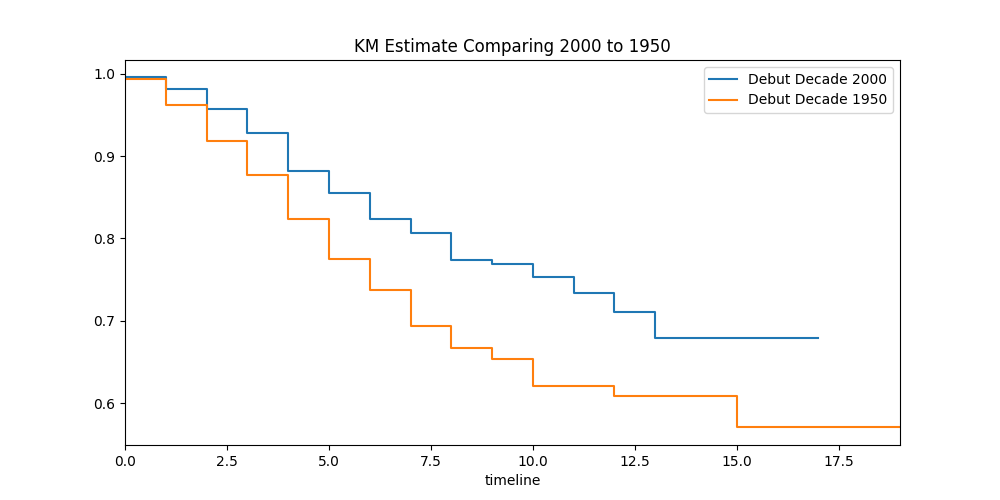
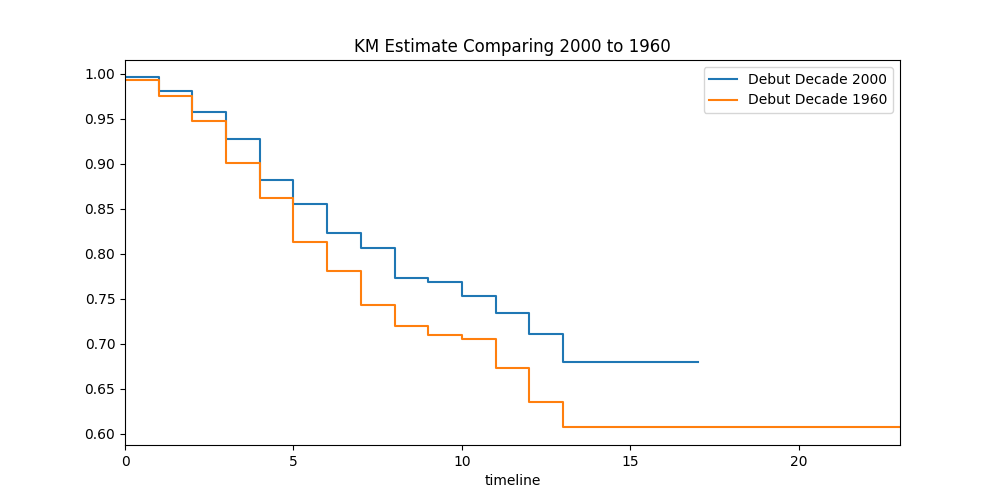
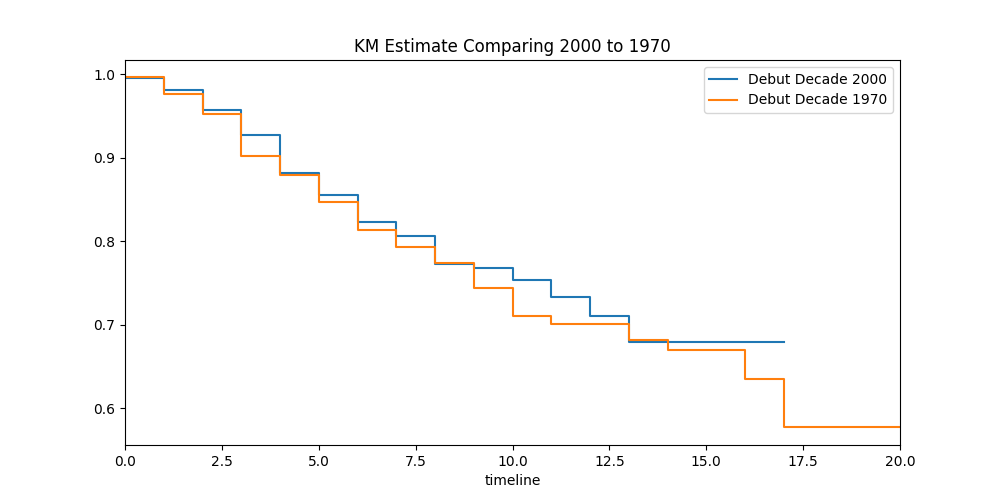
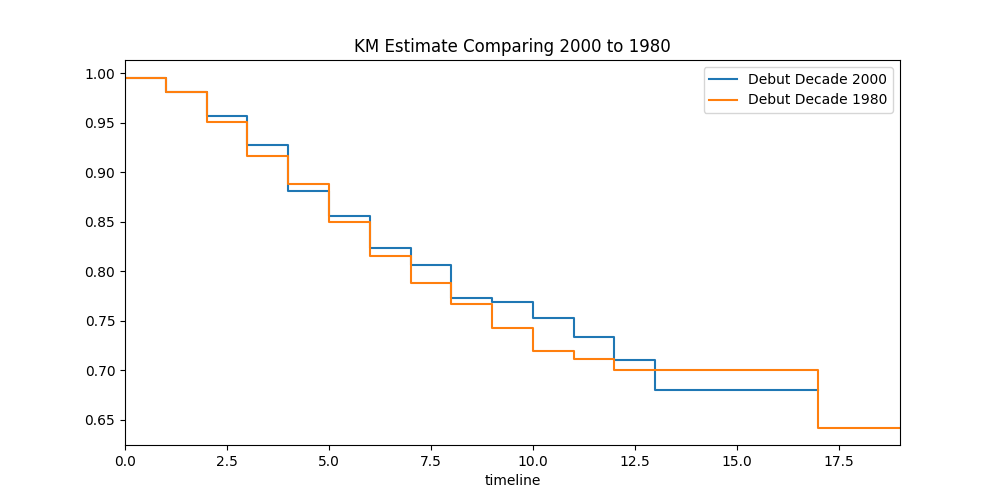
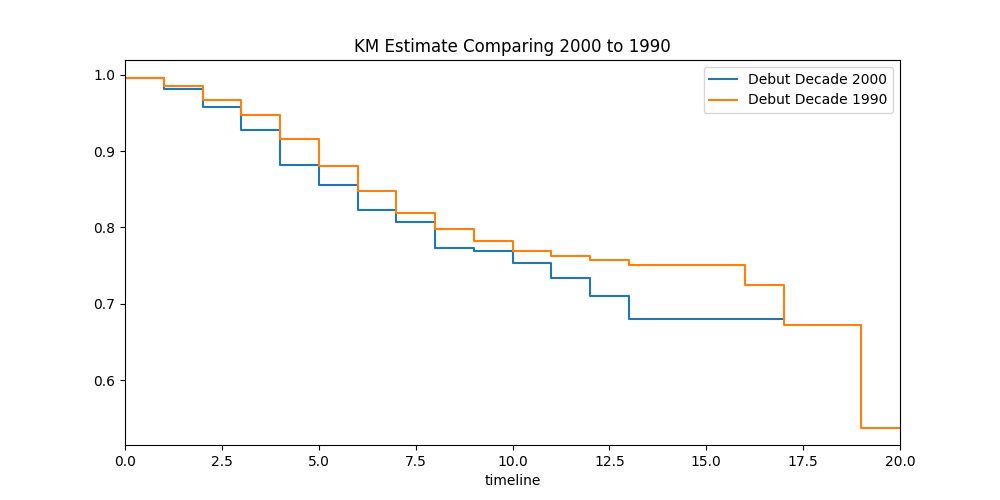
The subsequent charts present survival curves that compare the 2000 debut decade to previous decades. We see that players tended to make all-star teams much faster when they debuted in the 50s and 60s compared to the 2000s. The 70s and 80s look fairly similar to the 2000s. Compared to the 90s, players who debuted in the 2000s made all-star teams a little quicker.
Conclusion
Are stars more ephemeral? The answer is inconclusive. Some signs point toward “yes” and others “no”. I suppose this effort needs more work. And that is the beauty of baseball data science.