Here’s the scenario: Eighth inning in a tight game, a lefty walks to the plate against a right-handed pitcher. Any baseball fan knows what’s likely to happen…a call to the bullpen to bring in a left-handed pitcher.
Does switching pitchers in such scenarios reduce the probability of a team surrendering a run? More broadly, can we use machine learning to predict when a pitcher will surrender a run? This blog investigates answers to those research question.
Explore the Results
The web app below allows you to insert a scenario and receive a predicted probability of a pitcher surrendering a run in that given situation . The model does not predict if the pitcher will give up a run on the next play or later in the inning.
The probability is generated from a machine learning model trained on the attributes in the app. The model was trained on every MLB play from 2010-2016, and all data was obtained from Retrosheet. The model achieved favorable results on a hold-out set of data. For those familiar with data science, the ROC AUC on the test set was 0.82.
Though I combined several models into ensembles, I opted to use a logistic regression in the final app. I made this choice for two reasons: 1) its performance is basically as good as any model I trained, and 2) logistic regressions tend to calibrate class probabilities well (i.e. they ensure that probabilities don’t glob around certain values). However, a logistic regression probably does not capture some of the interactions among variables that a tree-based model, like a random forest, might. Trade-offs…you can’t avoid them.
In many cases, model ensembles provide a lift over any single model, but for this problem, I think there are cases for which no model can control without extensive feature engineering (e.g. a player was out of position, the runner on second was slow, etc).
To note, the team names are from Retrosheet, so they may not always match expectations. For example, CHN represents Chicago National (the Cubs) whereas CHA stands for Chicago American (the White Sox).
In using the app to inspect scenarios, the results make intuitive sense to me. (The model “hedges” a bit, rarely outputting probabilities close to zero, though.) Try it out and let me know what you think! Please note, the app may take a few seconds to load.
After hitting submit, scroll up to see the prediction. Refresh the page to enter another scenario.
After hitting submit, scroll up to see the prediction. Refresh the page to enter another scenario.
Descriptive Analysis
I also ran descriptive analysis on the data described above. The below d3-based graphics present a selection of outcomes in different situations. All results, as well as all my code (Python for the win!), can be found on GitHub.
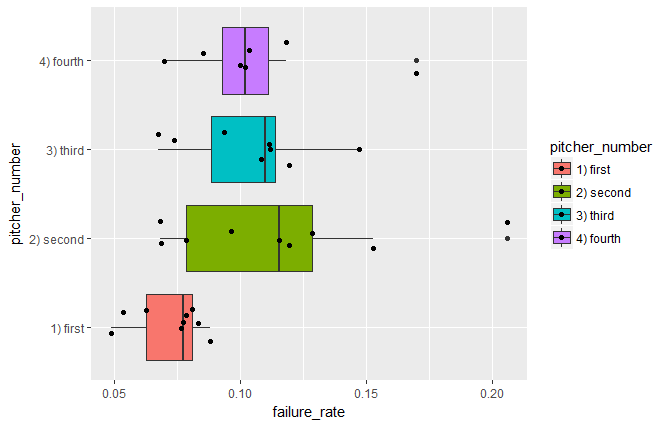
Specifically, the charts show failure rates (e.g. how often a pitcher gives up a run) segmented by the pitcher number (e.g. the nth pitcher to enter the game).
Hover over the bars!
Final Thoughts on the Model
You might be thinking, why use a model to produce a probability rather than directly calculate the value from the data? The answer: models help capture signal. Both signal and noise are in the data set, and directly calculating the probability would assuredly factor in the noise. By using a machine learning model, we can hopefully cut through some of the noise and produce more generalizable results.
Building this machine learning model was certainly challenging and rewarding. Oftentimes, I like to use some type of feature selection to help avoid over-fitting (i.e. capturing both signal and noise), but in this case, such an approach might not have been optimal. In the web app, it makes most sense to have the full set of 30 teams. With feature selection, I might have eliminated a few teams, which wouldn’t be intuitive for the web app user. However, I used l2 regularization in the logistic regression as a way to help prevent over-fitting.
Speaking of over-fitting, I considered using players as features. For example, what is the probability that Clayton Kershaw surrenders a run with Paul Goldschmidt at the plate in a given scenario? This could have been cool, but fighting over-fitting would have been top-of-mind, especially with players who only had quick stints in the majors. Instead, I opted to include ERA, OPS, and the number of in-season match-ups between the pitcher and hitter. Intuitively, these seemed like useful proxy figures that would hopefully generalize more effectively.
And that’s a wrap. I have plenty of exciting blogs planned for 2018!