Many people who follow the MLB know attendance is down in 2018. The season will likely end with a year-over-year attendance decline of about 4.5%. Many people attribute the decline to fundamental changes in the game: less action caused by fewer home runs and more strikeouts (a topic for another blog).
The situation surfaces a number of natural research questions, two of which are: 1) was the drop in attendance foreseeable? and how rare is a 4.5% decline in attendance? Both questions hint at the concern Major League Baseball should have for the attendance slump.
Year-Over-Year Attendance Fluctuations
The chart below shows the year-over-year percentage change in attendance from 1970 – 2017. The largest peaks and valleys occurred around player strikes.
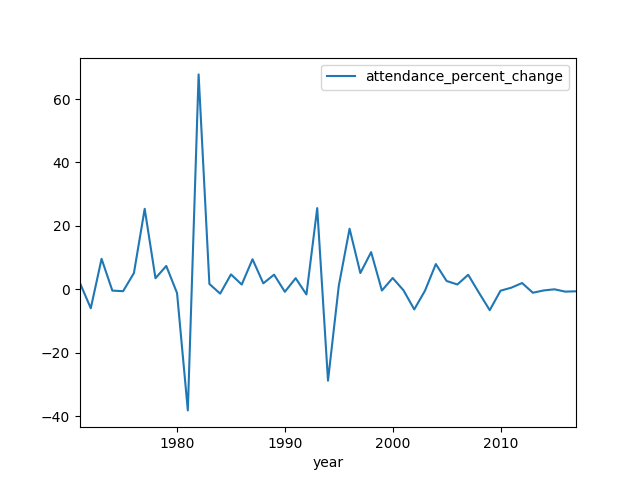
As we can see, attendance has been comparatively steady in recent years. However, the chart doesn’t show the nuance around the 0% mark. Over the past few years, attendance has dropped slightly year-over-year.
- 2013: -1.1%
- 2014: -0.38%
- 2015: -0.03%
- 2016: -0.76%
- 2017: -0.66%
Rareness of 2018 Drop in Attendance
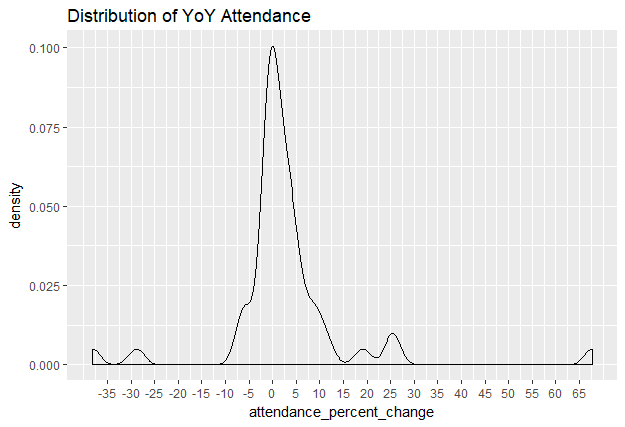
Based on the probability density function, we see that many year-over-year attendance changes hover around 0%, though some variation exists.
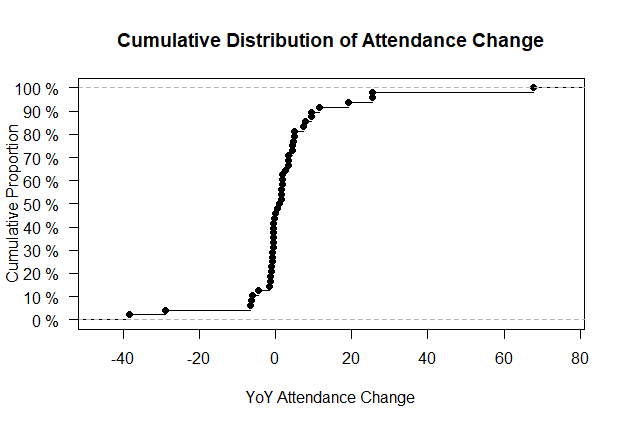
The cumulative distribution function shows a 4.5% drop in attendance is unusual, occurring in less than 15% of seasons. (Some of the seasons with large drops occurred during strikes, essentially making the 4.5% decline more rare).
Time-Series Analysis of Attendance
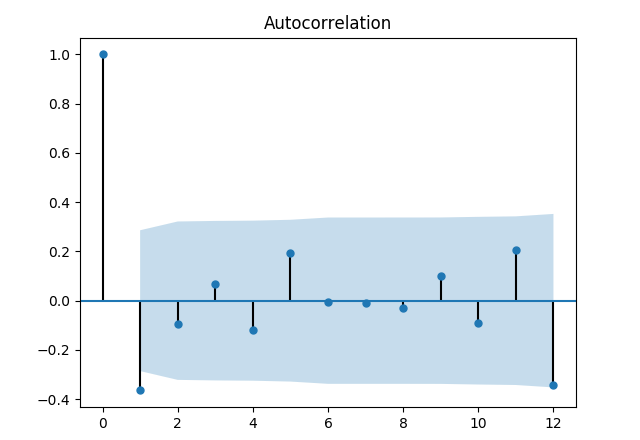
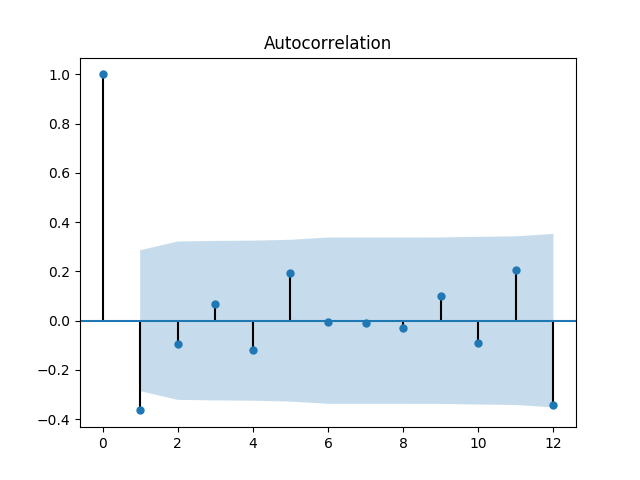
According to the Dickey-Fuller test, the year-over-year percentage change in attendance is stationary, meaning we can run a time-series model on it without transformation. The below chart shows the the autocorrelation of the time series, which is how correlated a value is with past values of itself. As we can see, percent change in attendance only has a statistically-significant correlation with the most recent lag.
Due to low autocorrelation, noise, and a recent lack of strong fluctuation, this time series is difficult to predict. I tried multiple approaches, including ARIMA, LSTM, and Prophet (which uses GLMs under the hood, I believe). I trained on 1970 – 2014 and used 2015 – 2018 as my validation set.
ARIMA performed best, but it still did not quite capture the recent attendance declines. For example, the model predicted a 0.15% increase in 2017 when attendance actually declined by 0.66%. Likewise, the model forecasted a 0.10% bump in attendance in 2018, though we know that won’t be the case.
What can we conclude? 1) The 2018 decline in attendance is comparatively rare. 2) The downtown did not appear to be highly foreseeable, indicating some exogenous change (i.e. perhaps the change in style of play).