Latent class analysis (LCA) is one of my favorite analytical techniques. Essentially, as the name indicates, the algorithm attempts to discover latent classes in categorical data. For this blog, I applied LCA on Chris Sale’s Pitchfx data to see if the algorithm could correctly identify his pitches. As always, code can be found on GitHub.
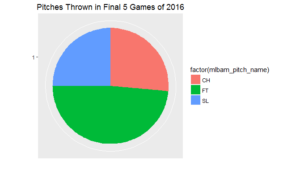
As a first step, I created a web scraper to ingest Pitchfx data for Chris Sale’s last five games of the 2016 season. For those unfamiliar with Pitchfx, it provides detailed data on items like pitch movement, spin, and acceleration. In sum, Sale threw 499 pitches in his last five games of 2016. More specifically, Sale threw three different pitches during these games: fastball, change-up, and slider.
After ingestion, I subsetted the data to include the variables most likely to differentiate pitches: spin, vertical movement, horizontal movement, start speed, three measures of velocity, and three measures of acceleration. Since all this data was numeric, and LCA works on categorical data, I wrangled each column into quartile values.
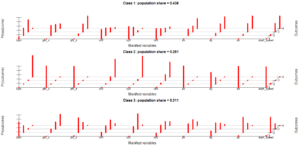
Since Sale threw three different pitches, I’m most interested to see the performance of the LCA model when we instruct it to find three underlying classes. The chart below displays the probability of an item in each latent class (i.e. a pitch) landing in a certain variable quartile. To note, variables that start with “p” correspond to movement, those that start with “v” correspond to velocity, and the variables that begin with “a” correspond to acceleration.
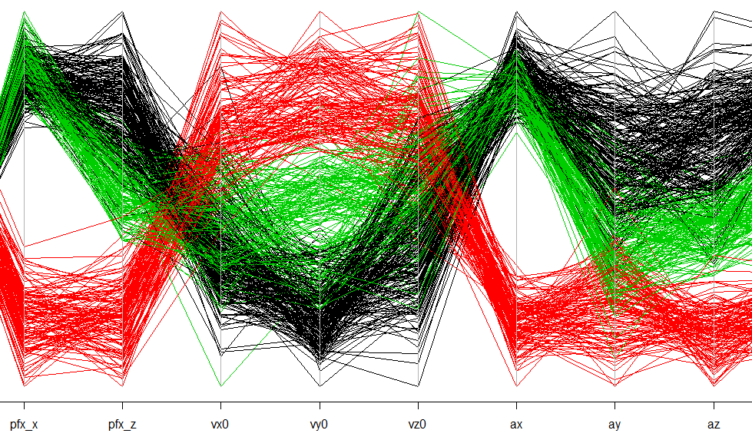
The parallel coordinates plot below is a bit easier to digest. The red represents Sale’s sliders; the LCA model put all 125 sliders in the same class. The black represents mostly fastballs; 205 fastballs and 15 change-ups were placed in this class. The green corresponds to mostly change-ups, with the class having 117 change-ups and 37 fastballs. To note, the Pitchfx metrics are not always the most intuitive, so don’t interpret this chart as saying that fastballs have the lowest velocity. We care about the clusters in the chart and that each class is (mostly) distinct on every measure.
Overall, the algorithm does a pretty decent job of finding underlying classes of data that correspond to Sale’s pitches!