This is a short post about finding similarities among the offenses of MLB teams. To accomplish this aim, I used two statistical methodologies that work on distance measures. As always, code can be found on GitHub.
About the Data
The dataset is pretty straightforward. I created a webscraper to extract each team’s 2016 offensive statistics. A little wrangling was required to get the final dataset: aggregated statistics for each team on items like home runs, batting average, and runs scored.
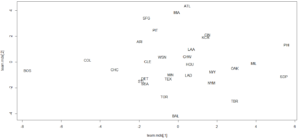
Multidimensional Scaling
Multidimensional scaling (MDS) finds lower dimensional representations of data. Essentially, the methodology works with distances to uncover a lower dimensional map that preserves similarities among items. The graph below is a perceptual map that displays the results of the MDS solution. Teams close together on the map are similar to each other. For example, the Royals are the Reds are close on the map, indicating their offenses are highly similar (according to MDS).
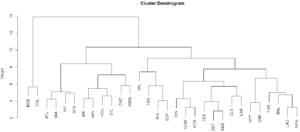
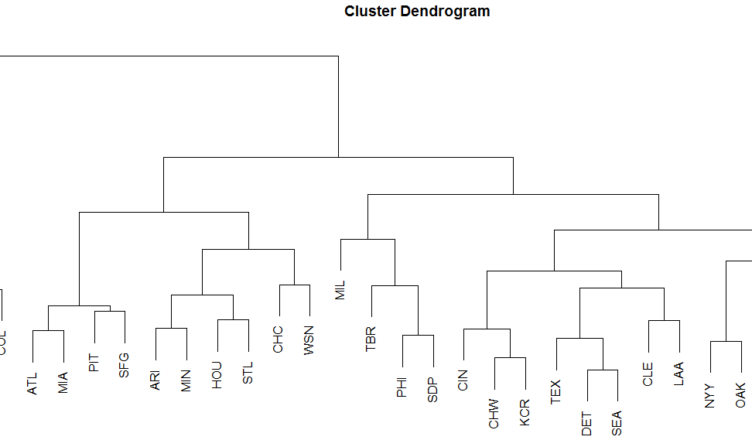
Hierarchical Clustering
Hierarchical clustering is another methodology that can help us understand which teams are most similar. This algorithm reports a metric for the distance between each pair of observations. Teams close together in the below dendrogram are most similar. For instance, according to the algorithm, the Dodgers were most similar to the Mets.