Survival analysis inspects, well, how long an entity survives. In less morbid terms, it’s a methodology to understand time until event. This blog applies survival analysis on a dataset of baseball career lengths.
About the Data
Career lengths are measured in days (including off seasons), and this dataset includes position players from 1985 – 2016. One of the benefits of survival analysis is that it can handle censored data. In this case, current players are censored – they haven’t yet retired. By marking these players as being “censored”, we can still include this data in a survival model.
Survival Curves
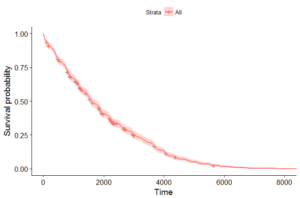
Survival curves display the survival probability at different points in time. In the below survival curve of baseball career lengths, we see, for example, that few players remain after 6,000 days (about 16 years).
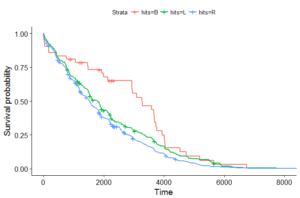
We can also break out survival curves into classes of players. The plot below displays survival curves by switch-hitter, right-handed hitter, and left-handed hitter. Interestingly, switch-hitters retire at a much slower pace until the 4,000 day mark (green line). On the surface, this makes sense – switch-hitters tend to be good athletes, so it stands to reasons they would possess longevity.
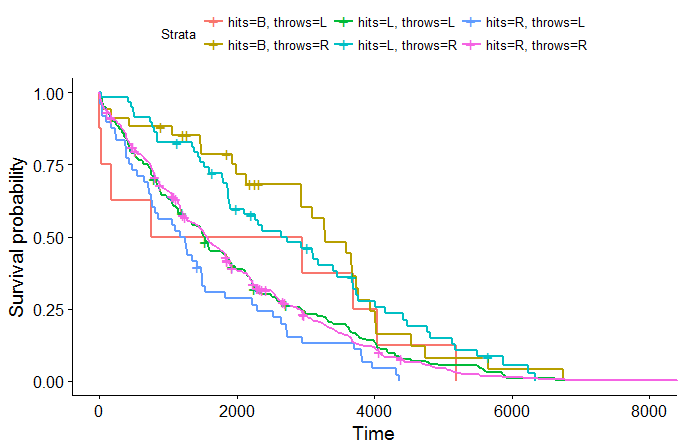
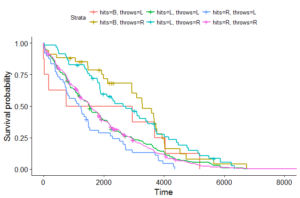
What about survival curves by how players hit and throw? That, too, can be done and is shown below. When we break out switch-hitters into how they throw (left-handed or right-handed), we get a pretty small sample size, so I don’t want to put a ton of stock into those curves (though they are interesting). We are able to clearly see that players who hit left-handed and throw right-handed have higher probabilities of lasting longer compared to lefty-lefty and righty-righty players. We also see that players who hit right-handed but throw left-handed, which is pretty rare, are typically quicker to retire.
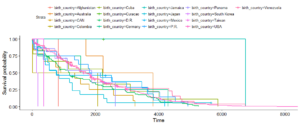
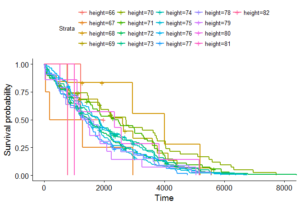
What about some more intricate survival curves? Below are survival curves for career length by birth country and by height. Both are pretty messy, though we can see career lengths differ on these dimensions.
Cox PH Regression
Cox PH regression allows us to predict time-to-event variables. To more accurately assess the impact of multiple variables on career length, I built a Cox regression model with the following predictors:
- average salary (with all salaries being converted into 2016 dollars)
- birth country
- weight
- height
- right-handed or left-handed hitter
- right-handed or left-handed thrower
- age at time of MLB debut
I didn’t include traditional stats like batting average or home runs. It’s fairly obvious that good players last longer.
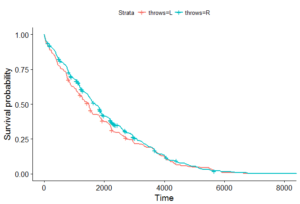
Four variables are statistically significant: weight, height, throwing hand, and age at debut. Increases in both height and weight lead to increases in the hazard ratio, which indicates worse survival (i.e. shorter careers). That is, on average, bigger players have shorter careers, which makes sense in some respects. (However, this relationship is likely non-linear, and this linear approach surely blands out interesting nuance). Likewise, increases in a player’s MLB debut age correspond to increases in the hazard ratio (i.e. shorter careers). This is a no-brainer and encouraging the model didn’t miss this item. Interestingly, on average, throwing right-handed decreases the hazard ratio. That is, right-handed throwers have longer careers than left-handed throwers. The below survival curve bears this out.
Thoughts or questions? Leave them for me in the comments!