I’ve always found simulation modeling to be highly informative. Given certain conditions and logic, what is likely to happen given repeated trials? What is the range of possible values?
This blog applies a simulation model to investigate how good or not so good the Royals could be. For the six core, everyday players on the team, this model simulates 100 WAR values. These players are Salvador Perez, Eric Hosmer, Alcides Escobar, Mike Moustakes, Alex Gordon, and Lorenzo Cain. This methodology can help us see, for example, how likely it would be for these players to combine for 25+ WARs or even 30+ WARs. For those unfamiliar with the concept of WAR, it’s an acronym for Wins Above Replacement, a value for how many wins a player adds over an average, replacement-level player.
The simulation model is built upon each player’s historical WAR mean and range. While useful, this model is not perfect, as it does not account for improvement or decline over time.
Take a Guess
Before looking at the results, let’s play a little game. Can you guess the average of Hosmer’s simulated WAR values? You’ll get two guesses. Be sure to click the ‘Submit guess’ button after entering your guess.
Simulation Results
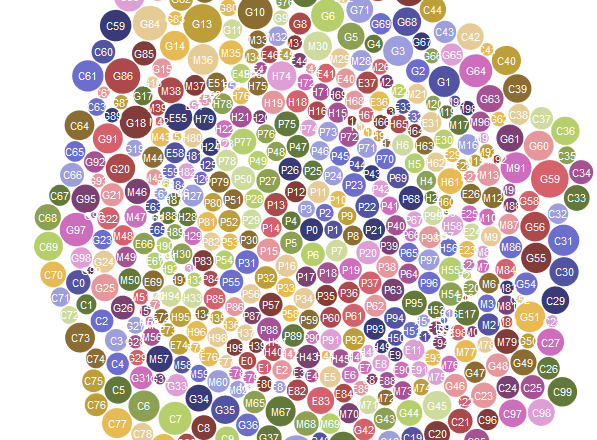
Now, let’s dive into the results. The bubble chart below shows the range of positive simulated WAR values. Each bubble has the first letter of the player’s name, and the number represents the simulation trial (1-100).
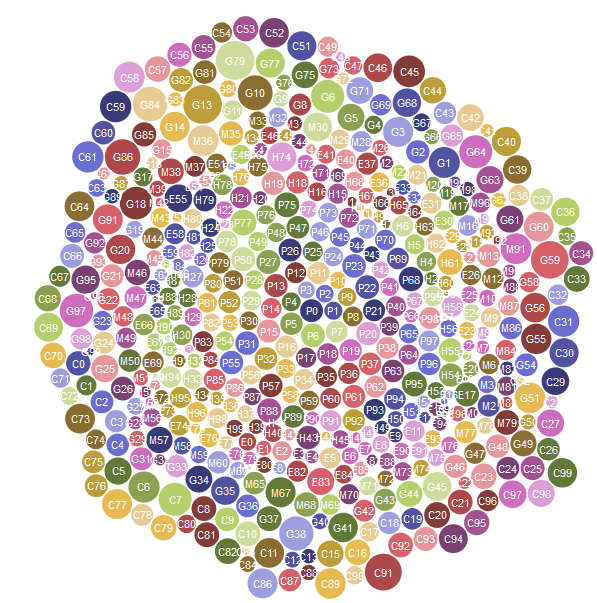
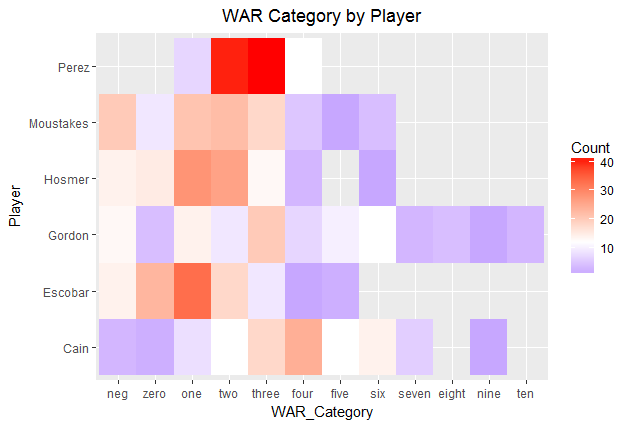
That is a bit overwhelming. Let’s try a heatmap instead. We see that Salvy almost always falls between 2-4 WARs. Moustakes often has fewer than three WARs, which is heavily impacted by the struggles early in his career. Hosmer and Escobar often skew to the lower end of the spectrum, too. Gordon has several high marks due to some really strong WARs a few years ago. Likewise, Cain often lands squarely in the 3-4 WAR range.
Based on these results, it doesn’t seem likely this cohort could collectively produce 25+ WARs. A more likely amount is 15 WARs, which isn’t that impressive of a number for six players combined.
These results may seem surprising to some Royals fans. However, many advanced metrics have never been kind to players like Hosmer, Escobar, and Perez. Additionally, the model does not weight the age of the historical WAR values. We know that Moustakes has gotten better and Gordon has gotten worse recently. Future work should use a weighted WAR.
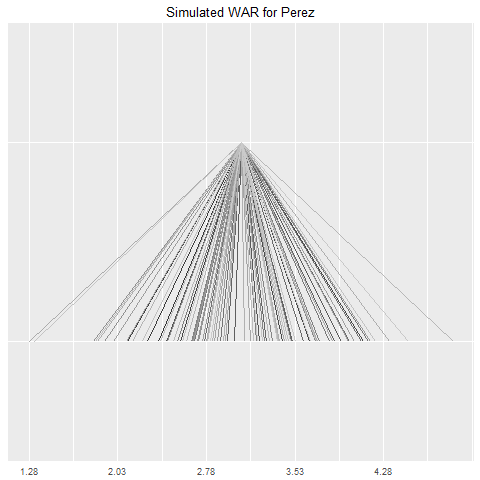
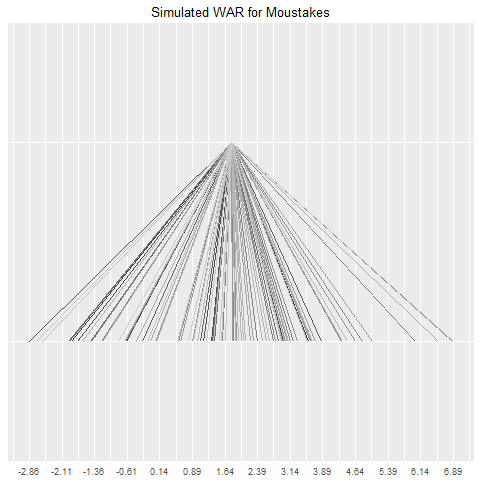
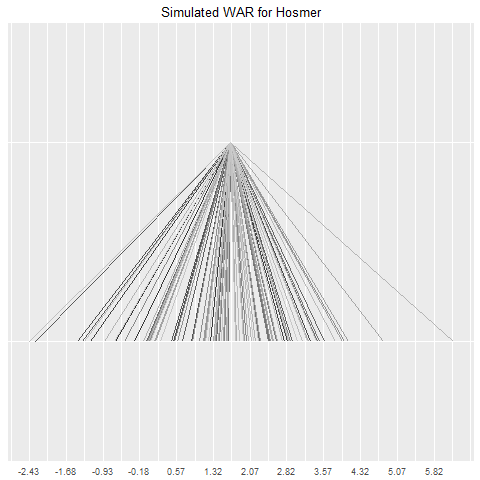
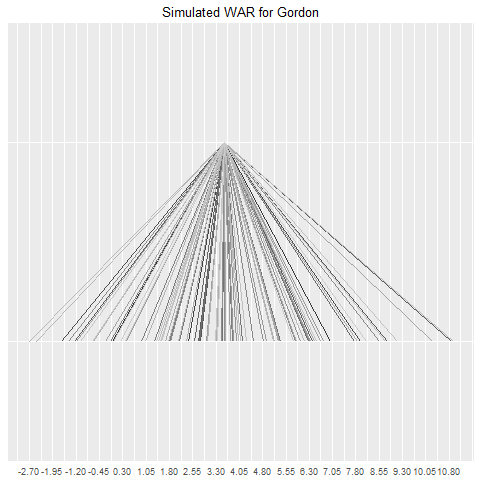
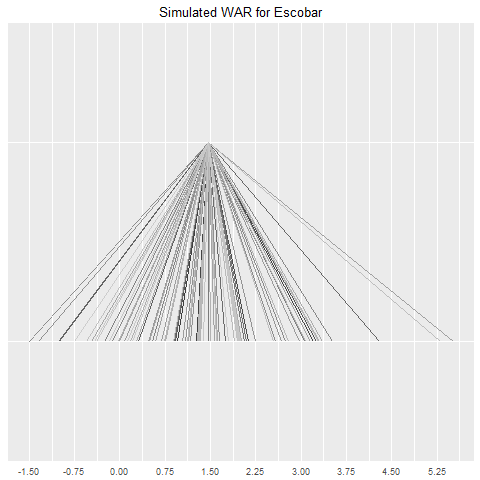
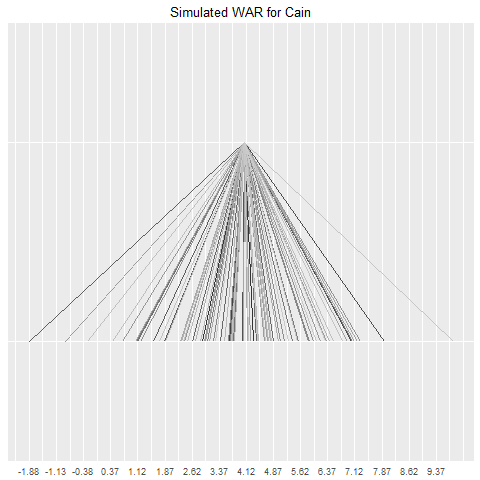
Individual Simulation Plots
To close, for those interested, here are individual simulation plots to show the nuance for each player. Each line represents one of the simulation results.