I’ve had several conversations recently about the nature of baseball stats compared to statistics in other sports, like football and basketball. Baseball, to a larger degree, allows us to compare players over time with more confidence. In general, player performance is more independent than other major sports (i.e. even if a baseball team is terrible, an individual player’s at bats are fairly standalone events, but if an offensive line is horrible, a running back’s performance will suffer greatly). Additionally, at least subjectively, it seems the game of baseball has held more stable over time. Take some of the best baseball teams from the 80s. They could hang with today’s Cubs or Nats in a best of seven series. I don’t think the same could be said for basketball or football.
This blog takes advantage of the ability to compare baseball players over time. Leveraging a framework often used to construct recommendation systems, I built a Python script based on standard, aggregated pitching stats that surfaced pitchers with similar seasons. (Standard stats are items like ERA, home runs allowed per game, walks issued per game, etc). Basically, the program “recommended” similar pitchers.
For example, which pitchers had seasons most similar to Curt Schilling’s 2001 season? Well, we see 2002 Curt Schilling (93% similarity), 2016 Max Scherzer (89% similarity), and 1996 John Smoltz (88% similarity). What about Greg Maddux’s 1992 season? We don’t see too many of his contemporaries. In fact, 12 of the top 15 most similar seasons were prior to 1990 (including Dazzy Vance from 1928).
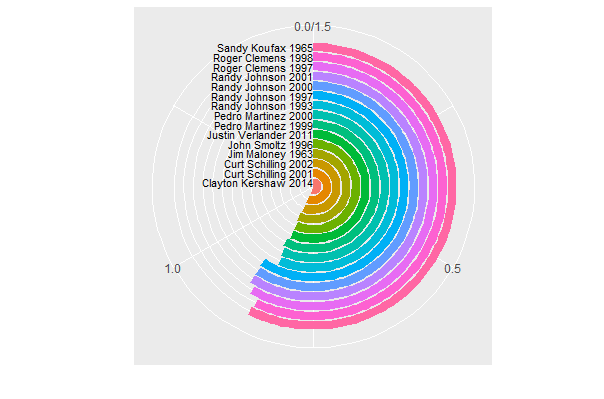
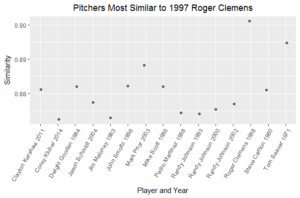
If we look at Roger Clemens’ 1997 season, we see an interesting mix of contemporaries and players from previous decades.
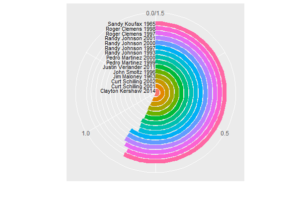
What about Randy Johnson’s dominant 2002 season? In the chart below, the more complete the circle (the closer it is to one), the more similar the season to Johnson’s 2002 performance. In addition to several contemporaries, we see similar seasons by Sandy Koufax and Jim Maloney (who won 23 games in 1963). However, well, Randy Johnson was most similar to earlier versions of himself.
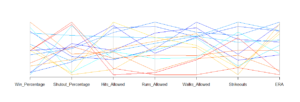
Let’s look at a slightly more recent season, Zack Greinke’s performance in 2009. The table below displays a selection of player stats (re-scaled to be 0 -100) for the seasons most similar to Greinke’s 2009 performance. Remember Kevin Brown?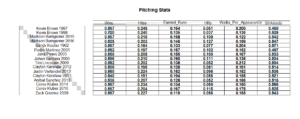 Though there is overall similarity among pitchers, which can be more than 90% overall, not all players perform in lock step on all metrics. The chart below compares stats for the seasons most similar to Pedro Martinez in 2000, with each line representing a pitcher (top similarities: 2015 Clayton Kershaw, 90% similar; 2000 Randy Johnson, 87% similar; 2001 Randy Johnson, 86% similar). Though these seasons are more than 80% similar to Pedro in 2000, we don’t see too many lines that move in lock-step. While these stats are in the same range, it’s interesting to note there is variation within that range.
 Next up, we’ll apply some novel statistical methods to better understand players and teams. Stay tuned for items like Markov models and general additive models!