One of my favorite parts of baseball data is its depth. So many interesting nuances exist – we just have to look! That is the focus of this blog: uncovering interesting data points in 2016 game logs, with emphasis on pitching data.
About the Data
I created a webscraper in Python to extract each team’s 2016 pitching logs. Essentially, this data includes per-game summary statistics on items like hits allowed or number of pitches. I created a fairly extensive iPython Notebook to accompany this blog where you can explore the data further.
Common Game Values
After scraping and munging, Python read the data as strings. So when we run a summary of the data, Python returns the most popular strings, basically telling us common categories for different variables. Here are some findings I found interesting:
- The most frequent number of hits allowed in a game was 7 (520 instances)
- The most common number of runs allowed in a game was 3 (649 instances)
- The most frequent number of walks allowed in a game was also 3 (919 instances)
- The most common number of pitches thrown in a game was 141 (97 instances)
Analysis over Time
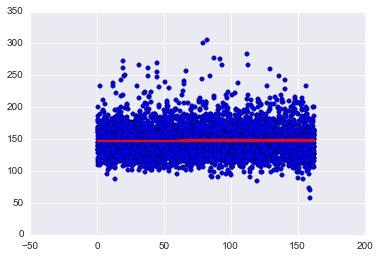
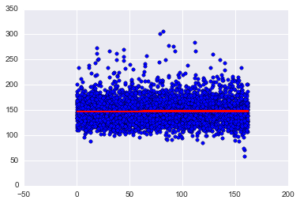
Interestingly, I didn’t find notable trends and patterns over time (though I didn’t explore every variable). Most regression plots look like the following graph of number of pitches vs. game number, indicating a flat relationship over time.
Home vs. Away Breakdown
What about home vs. away? Are there substantial differences in pitching metrics based on this condition? Well, most stats were pretty close, and differences could likely be chalked up to random noise.
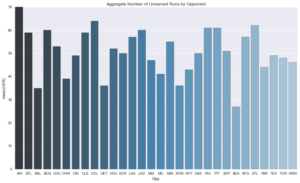
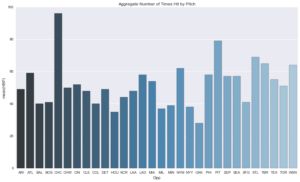
Opponents
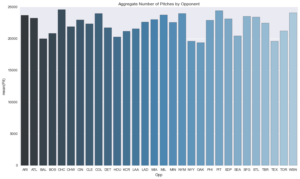
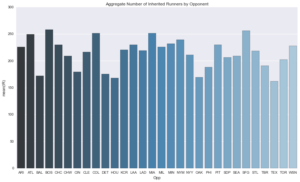
Do we see any interesting patterns when we segment the data by opponent? I exported the data segmented by opponent to Excel and used conditional formatting to display where each team ranked in aggregate on each metric (download file: opponent_stats).
Here are some interesting rankings. (I’m focusing on stats mostly relevant to pitching/defensive performance).
- The Cubs drew the most walks (646).
- The Brewers were caught stealing the most times (55).
- Likewise, the Brewers stole the most bases (179).
- The Braves grounded into the most double plays (146).
- The Braves also drew the most intentional walks (60)
Conclusions
For additional analysis on this data, please refer to the iPython Notebook. While this was a pretty straightforward data ingestion and wrangling project, more advanced analyses will come in the next few posts!
As always, thank you for reading.