Since my beloved Kansas City Royals did not make the playoffs, I almost cannot bring myself to pen a post about October baseball. So, I opted to analyze game logs from the regular season and apply association rules mining in an effort to find unique patterns in game data. As always, the R code for the analysis can be found on GitHub.
A Few Interesting Factoids
After scraping and joining each team’s offensive and pitching/defensive game logs, I sorted the data to find some interesting data points. For your upcoming holiday parties, these stats might come in handy:
- The Giants were the only team in the MLB to have two games with four triples (Aug. 28 against ATL and Sept. 27 against COL).
- The fewest pitches thrown by a team in a game was on Sept. 29, in a shortened matchup between the Cubs and the Pirates (57 pitches by the Cubs). The fewest pitches thrown in a 9 inning game was by the Red Sox on Sept. 29 against the Orioles (89 pitches by Boston).
- There were only three games where a team did not leave any runners on base (the Padres, Yankees, and Brewers each did this once).
Understanding the Data
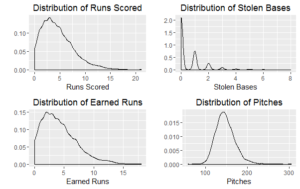
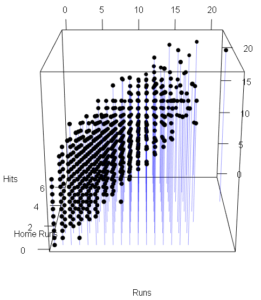
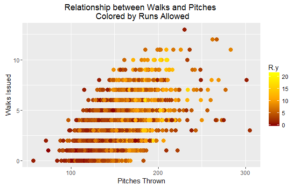
I also created a few visualizations to help me better understand the data and the relationship between selected variables. Below are three selected charts, which I’ll let you review since this will be a pretty text-heavy post.
Association Rules Mining
The main part of this analysis was using association rules mining to uncover interesting patterns in game logs. The idea is to discover events that occur together more often than what would be expected from their individual rates of occurrence. This methodology is often applied to shopping data: When someone buys eggs, what else do they commonly purchase?
Three main metrics are part of association rules mining. 1) Support: how popular an itemset is. In a hypothetical baseball season (I’m literally making these numbers up as I write), if there were 10 games that had three runs scored and also had one home run out of 162 games, then the support for those two items (three runs scored and one home run) would be 10/162 = 6.2%. 2) Confidence: how likely an event is to occur when another event occurs. Back to our simple baseball example. Let’s say that there were 20 games that had four errors, and in those 20 games, 12 also had five walks. So the confidence that four errors occur in games with five walks would be (12/162)/(20/162) = 60%. Pretty intuitive. 3) Lift: how likely an event is to occur when another event occurs, controlling for how popular the event is. It’s a bit of a mouthful, so back to our example one final time. Let’s reuse our data from the illustration of confidence with one additional data point; there were 25 games with five walks. To calculate lift, we would do the following: (12/162)/((20/162) * (25/162)) = 31. Any lift greater than 1 means that the items are likely to occur together, so a lift of 31 is quite substantial. Essentially, both items are pretty rare in a 162 game season, but they occur together with a pretty remarkable frequency.
OK, so that’s the gist of association rules. How do we apply it to game logs?
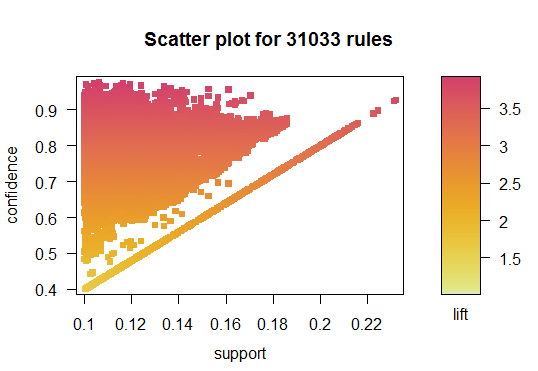
This methodology will only work on categorical data, so I relabeled each observation to fall into a quartile. The final dataset included 44 columns of data, covering all of the standard pitching, defensive, and offensive statistics. The scatter plot below displays 31K + rules that were developed on the data.

So now you’re probably asking, what events in a baseball game occur together? Below is a visualization of the top 50 rules by lift. Essentially, we see items in the first quartile (bottom performance) grouped and items in the fourth quartile (top performance) grouped. So…nothing too shocking. If we inspect a wider set of rules, we continue to see the same patterns – quartiles are grouped.
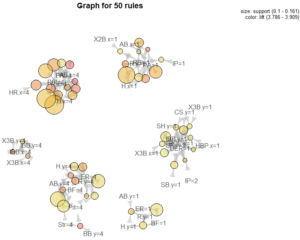
Overall, the “most popular” rules are not too interesting; items of the same quartile are almost always grouped together. My hope was to uncover unique connections, but that didn’t quite pan out. Possibly, splitting the data into finer segments than quartiles could have helped unearth more interesting patters.
However, this is one aspect of data science: you have to go through the process of running a model and reviewing results to know if any worthwhile takeaways exist.