In early 2015, Twitter released an open-source R package for anomaly detection. Thinking this package would be a springboard for an interesting blog, I scraped the Royals’ 2016 offensive statistics from Baseball Reference and used Twitter’s algorithm to find anomalies throughout the season. As always, the code for this analysis can be found on GitHub.
The algorithm seeks out both global and local anomalies. Global anomalies are values distinctly different from all others in the dataset. Local anomalies break a distinct pattern in a defined range of the dataset.
Surprisingly, not many true anomalies existed in the data. Below are the results for some of the more interesting findings.
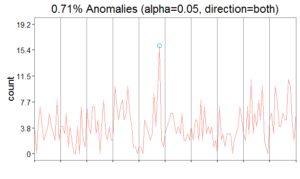
Runs – one anomaly (16 runs on June 18 against Detroit; this game was also the only anomaly for hits)
Stolen bases – two anomalies (four steals on April 21 against Detroit and four steals on April 29 against Seattle)
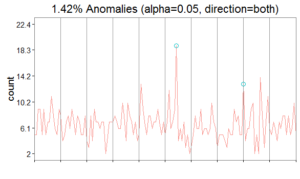
Runners left on base – two anomalies (19 LOB on June 19 against St. Louis and 13 LOB on August 10 against the White Sox)
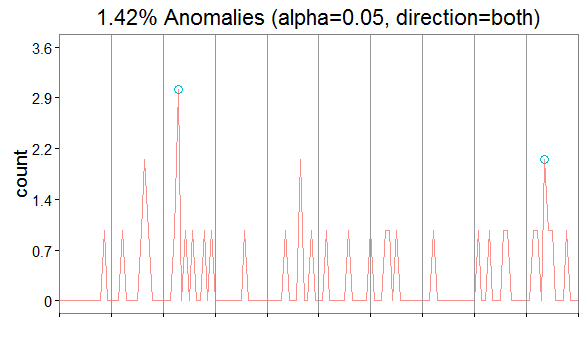
Hit by pitch – two anomalies (three HBP on May 10 against the Yankees and two HBP on August 30 against the Yankees)
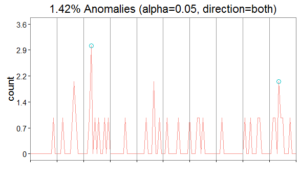
What I find most interesting is the concept of the local anomaly. The local anomalies the algorithm finds is contingent on the period argument we enter into R. For this analysis, I set period equal to seven (roughly representing a week of games, though off-days and double-headers make this imperfect).
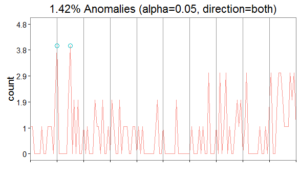
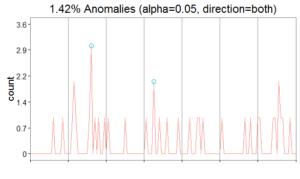
What happens if we change the period argument to make it shorter? Below are the results if we set period = 2 for the hit by pitch metric. We see the algorithm chooses different anomalies

We also see different results when we tell the algorithm to consider a longer period (=10).
I hope you enjoyed this short blog post! I’ll return with something a bit more in-depth in the next few weeks.